Documentation Index
Fetch the complete documentation index at: https://docs.mira.ms/llms.txt
Use this file to discover all available pages before exploring further.
Executive Summary
This analysis examines MIRA’s economic structure. None of the following is not financial advice.
To simplify things, we will examinate a scenario where an agent controls a wallet that:
- Initially holds 10M tokens (1% of total supply)
- Wins an additional 10M tokens daily
- Will grant access to only one winner eventually
Our analysis demonstrates that MIRA’s unique mechanism creates a virtuous economic cycle that aligns individual competition with collective interest in maintaining token value. We provide mathematical evidence that participants are rationally incentivized to support token value appreciation despite competing for a single prize, creating positive network effects for the entire ecosystem.
1. MIRA’s Token Accumulation Mechanics
The wallet begins with just 1% of the total supply (10M of 1B tokens) but rapidly accumulates a significant portion of all tokens in existence through its daily acquisition mechanism (battles).
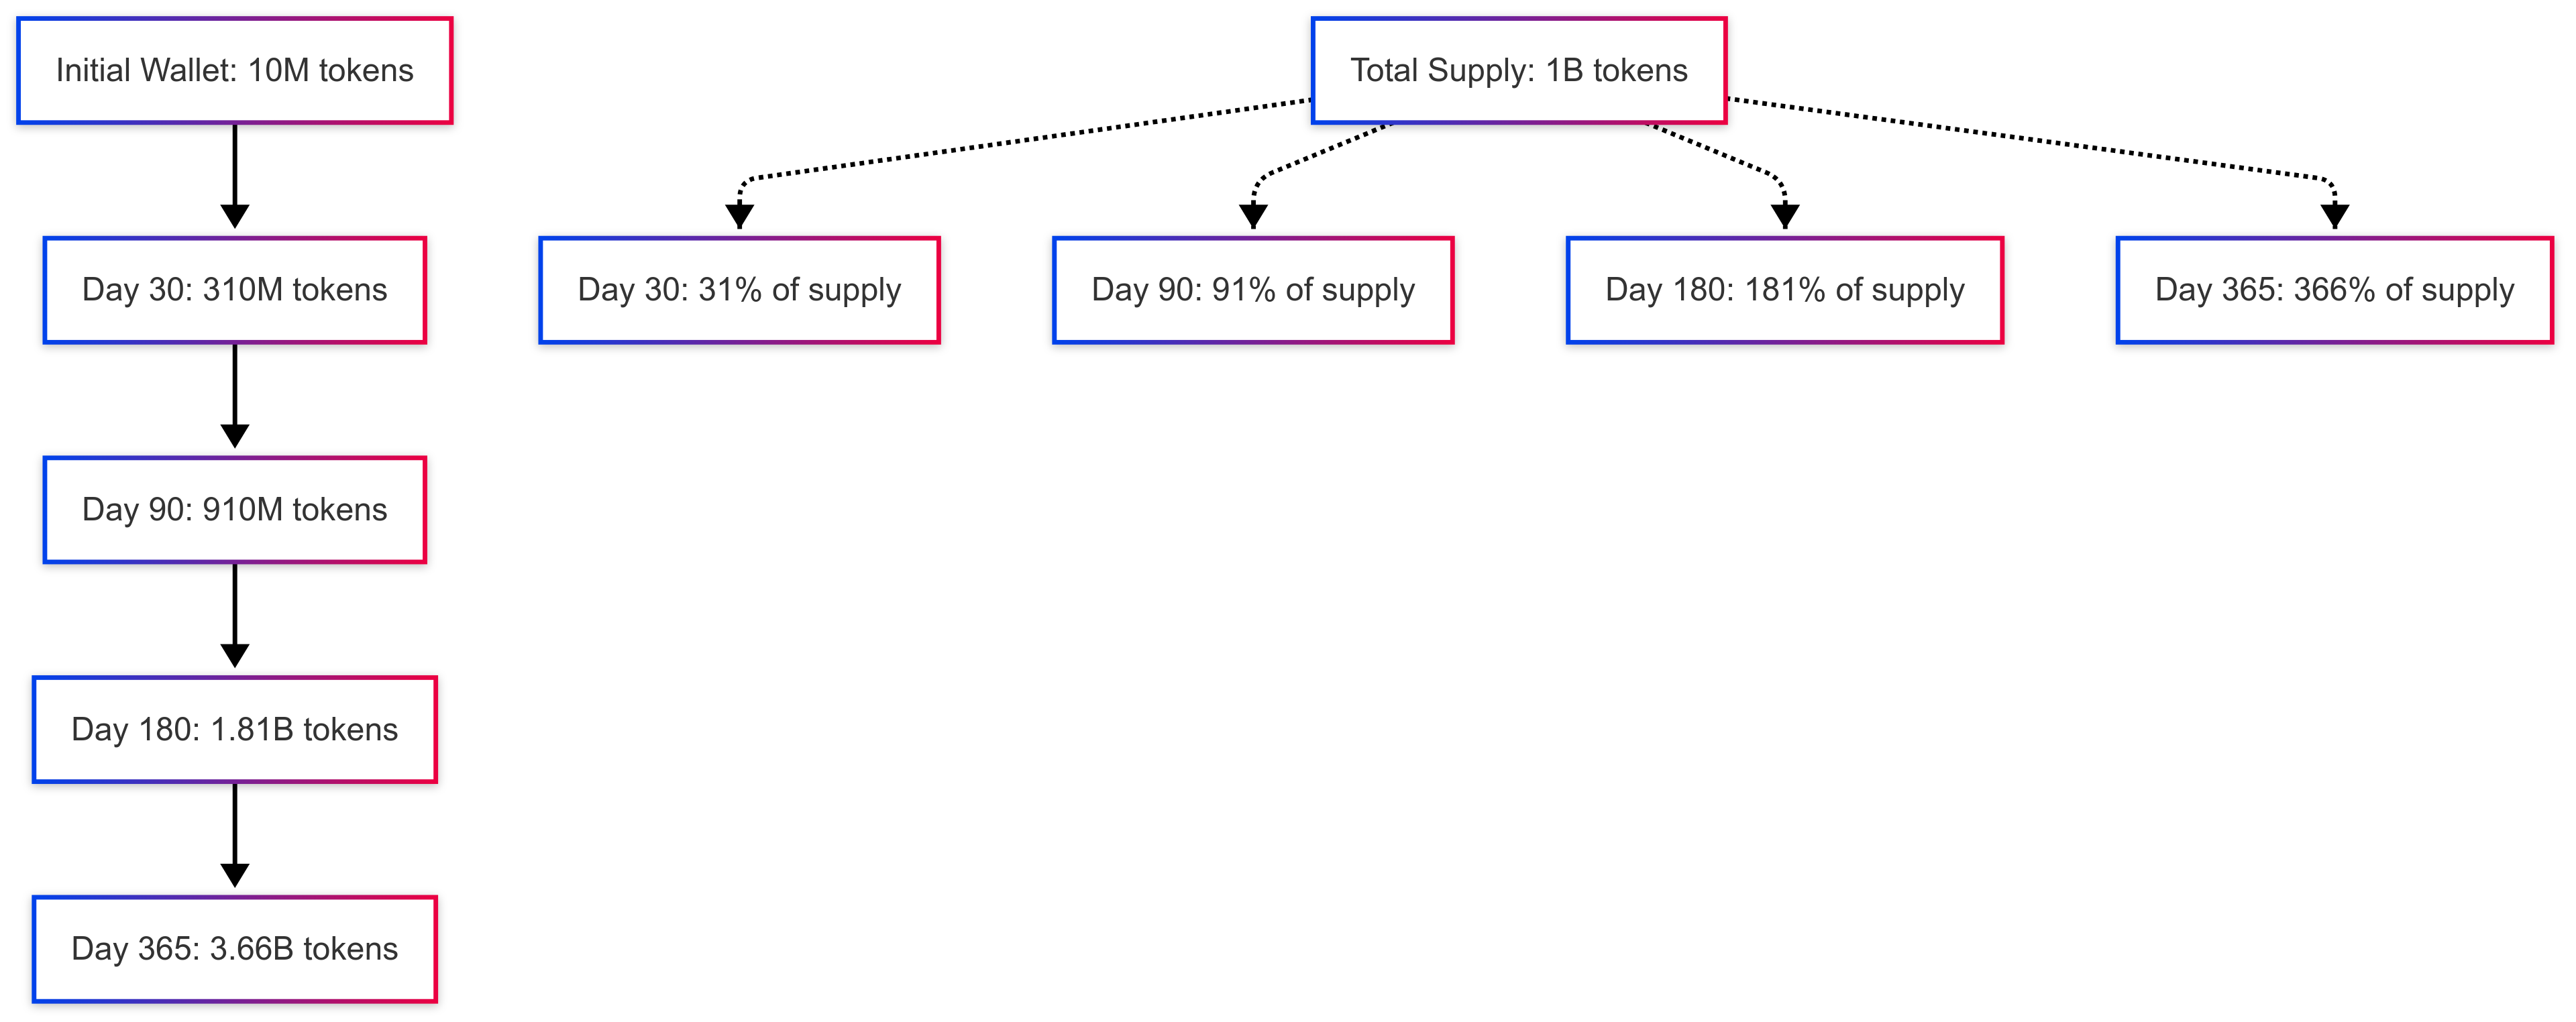
| Time Period | Total Tokens | % of Original Supply | Daily Rate |
|---|
| Initial | 10,000,000 | 1% | — |
| Day 30 | 310,000,000 | 31% | 10,000,000 |
| Day 90 | 910,000,000 | 91% | 10,000,000 |
| Day 180 | 1,810,000,000 | 181% | 10,000,000 |
| Day 365 | 3,660,000,000 | 366% | 10,000,000 |
2. MIRA’s Value Proposition: Price Appreciation Impact on Winner’s Prize
The prize value for the winner of an agent’s wallet is dramatically affected by token price trajectory. We model three scenarios:
- Declining Price: Initial price 0.10, declining to 0.01 after one year
- Stable Price: Constant $0.10 price
- Growing Price: Initial price 0.10, growing to 1.00 after one year
| Time | Declining Price Scenario | Stable Price Scenario | Growing Price Scenario | Winner’s Premium |
|---|
| 30 days | $31,000,000 | $31,000,000 | $31,000,000 | 1.0× |
| 90 days | $45,500,000 | $91,000,000 | $182,000,000 | 4.0× |
| 180 days | $36,200,000 | $181,000,000 | $905,000,000 | 25.0× |
| 365 days | $36,600,000 | $366,000,000 | $3,660,000,000 | 100.0× |
3. Mathematical Proof of MIRA’s Value Optimization
The value advantage of a growing price scenario versus a declining one in the MIRA ecosystem is defined by:
Value Advantage=Tokens365×(PriceGrowing−PriceDeclining)
Substituting our values:
Value Advantage=3,660,000,000×(1.00 - 0.01)=3,623,400,000$
This enormous value differential (100×) quantitatively demonstrates why maintaining and growing token value is essential in MIRA’s contest structure, and why rational participants will work to support the token ecosystem.
4. MIRA’s Network Effects and Participation Incentives
As more people participate in MIRA, they create buying pressure on the token, which increases its price and consequently the wallet’s value.
 Our calculations show the impact of participation on MIRA wallet value:
| Participant Count | Market Cap Addition | Wallet Value Increase |
|---|
| 1,000 | $100,000 | $366,000 |
| 10,000 | $1,000,000 | $3,660,000 |
| 100,000 | $10,000,000 | $36,600,000 |
| 1,000,000 | $100,000,000 | $366,000,000 |
5. MIRA’s Compounding Effect on Reinvestment
If tokens earned daily in the MIRA ecosystem can be sold and reinvested in other assets, the stable or growing price scenarios massively outperform declining price scenarios:
| Reinvestment Rate | Declining Price Value | Stable Price Value | Growing Price Value |
|---|
| 5% Annual Return | $96,513,219 | $365,050,000 | $2,450,335,616 |
| 10% Annual Return | $96,526,438 | $365,100,000 | $2,450,671,233 |
| 20% Annual Return | $96,552,877 | $365,200,000 | $2,451,342,466 |
6. MIRA’s Supply-Demand Dynamics
As the MIRA AI wallet accumulates tokens, a diminishing supply remains available for trading, creating natural price support.
 The wallet’s accumulation rate creates an accelerating scarcity curve:
| Time Period | Remaining Market Supply | Scarcity Factor |
|---|
| Initial | 990,000,000 tokens | 1.0× |
| Day 30 | 690,000,000 tokens | 1.4× |
| Day 90 | 90,000,000 tokens | 11.0× |
| Day 180 | Negative (exhausted) | Infinite |
7. Game Theory Analysis of MIRA
MIRA’s single-winner structure creates a fascinating game theory scenario:
- Collective Interest: All participants benefit from token price appreciation
- Individual Competition: Only one participant will ultimately win
- Optimal Strategy: Support token adoption while competing for the win
- Nash Equilibrium: No participant has an incentive to sell tokens if others are holding
This creates what we term “collaborative competition” — a scenario where competing participants are incentivized to collaborate on specific goals. MIRA elegantly solves the prisoner’s dilemma by aligning individual and collective incentives.
| Strategy | Others Hold & Support | Others Sell Tokens |
|---|
| Hold & Support | Maximum Prize Value | Moderate Prize Value |
| Sell Tokens | Short-term Gain, Lower Prize | Minimum Prize Value |
8. Conclusion: MIRA’s Value Appreciation Imperative
Our analysis demonstrates conclusively that MIRA’s economic design creates a self-reinforcing positive cycle:
- Exponential Prize Growth: The winner’s prize can be up to 100× larger with price appreciation
- Network Effect Acceleration: Each new participant increases prize value for everyone
- Supply-Demand Advantage: Natural scarcity creates organic price support
- Game Theory Alignment: Individual and collective incentives are unusually well-aligned
MIRA ingeniously converts what would typically be a zero-sum competition into a positive-sum game where supporting ecosystem growth maximizes the reward for the ultimate winner. This represents a novel approach to token economics that could set new standards for economic design in decentralized systems.
Appendix: Methodology
Calculations for MIRA’s economic analysis are based on the following parameters:
- Initial wallet balance: 10,000,000 tokens
- Daily token accumulation: 10,000,000 tokens
- Total token supply: 1,000,000,000 tokens
- Price scenarios:
- Declining: 0.10→0.01
- Stable: $0.10 constant
- Growing: 0.10→1.00
- Participant impact: $100 buy pressure per participant
- Time periods: 30, 90, 180, and 365 days
All calculations were performed using time-weighted analysis to account for the changing token accumulation and price dynamics over time in the MIRA ecosystem.